What You Can Track
This view gives you channel-wise and agent-wise breakdowns of:- Total number of questions and answers (Q&A) exchanged
- Channel-specific traffic (e.g., Playground, Web, WhatsApp, Discord, API)
- Which agents were most active
- How usage has trended over time
📈 This data helps identify engagement hotspots, uncover underused channels, and optimize where your AI is delivering the most value.
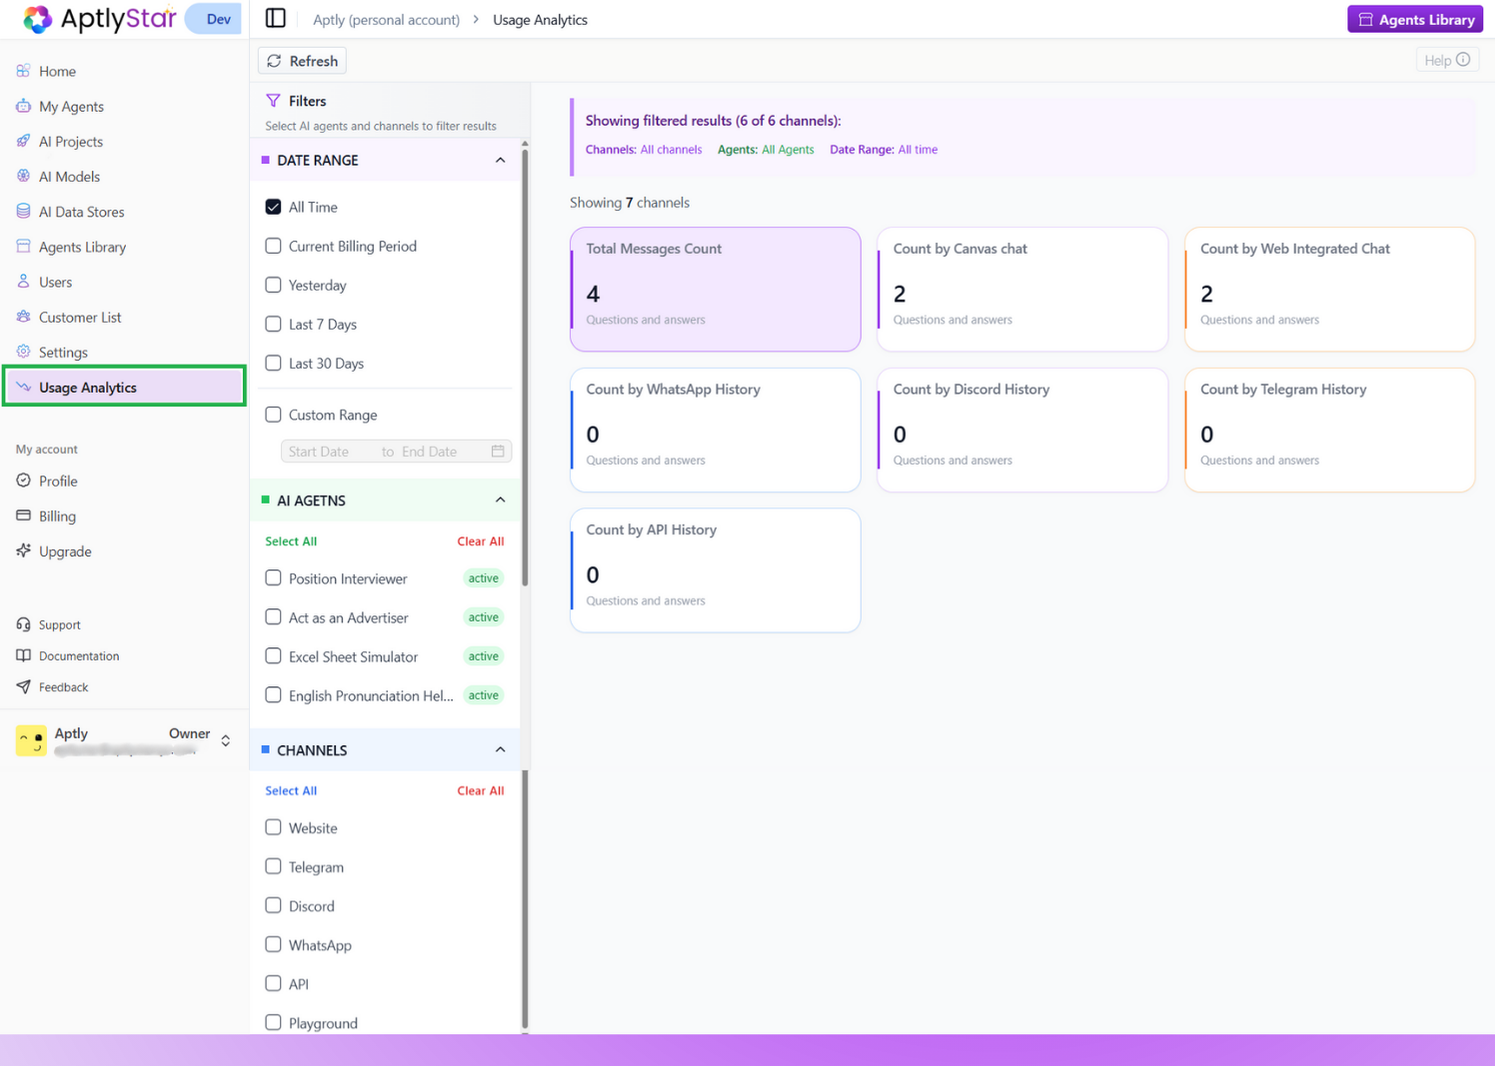
Filter Options
The left panel includes interactive filters to customize your analytics view.🗓️ Date Range
Select the timeframe you want to analyze:- All Time
- Yesterday
- Last 7 Days
- Last 30 Days
- Custom Range (using start and end dates)
Useful for comparing usage trends across months or analyzing spikes post-feature launches.
AI Agents
Toggle visibility for each AI agent in your org:- Check or uncheck individual agents
- Filter for active or offline agents
- Use “Select All” or “Clear All” for convenience
Great for seeing which agents are driving the most engagement or are currently inactive.
Channels
Analyze performance across different communication channels:- Website
- Telegram
- Discord
- API
- Playground
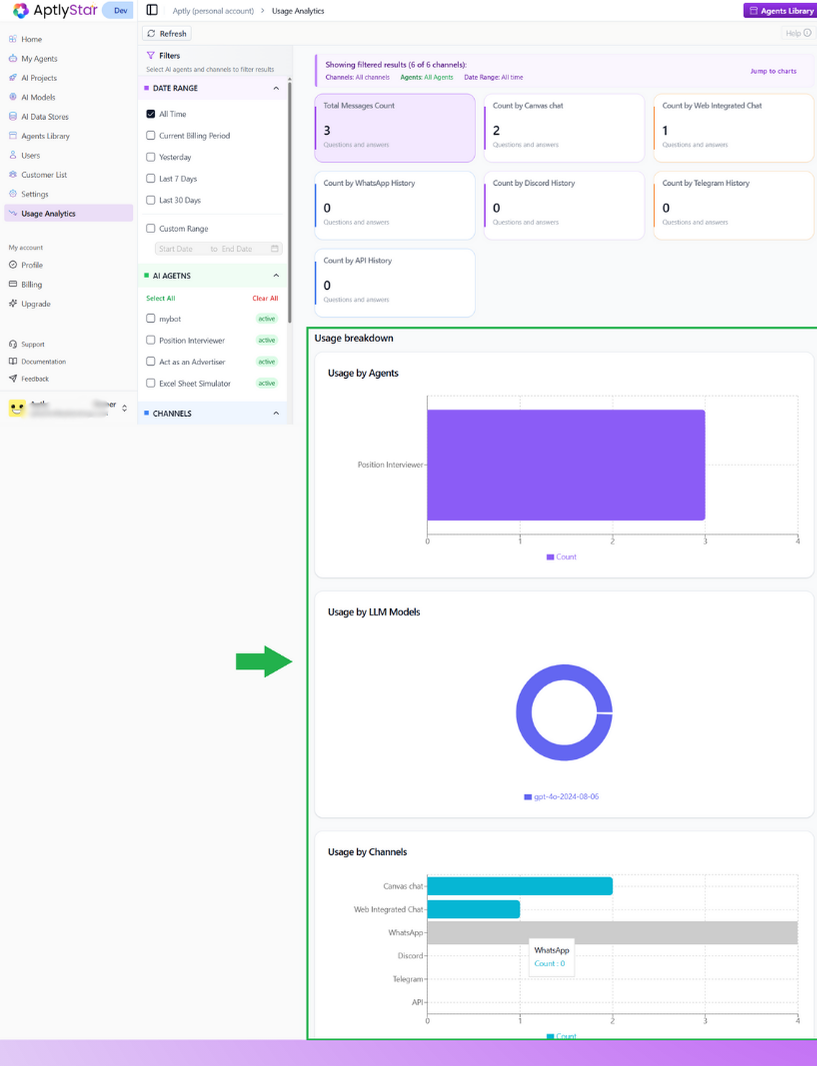
Visual Insights
In addition to summary cards, the dashboard now includes graphical breakdowns to make insights more intuitive:- Bar graphs to compare agent activity and channel performance
- Pie charts to visualize distribution of queries across LLM models
- Trend visualizations to quickly spot spikes or drops
Interpreting the Results
Once filters are applied, the right panel will display visual summary cards for each channel. Each card shows:- Total Q&A count for that channel
- A unified metric across all selected agents and date range
Why It Matters
This page helps your organization:- Monitor real-time usage across all AI integrations
- Diagnose drops or spikes in channel traffic
- Audit agent activity across internal and public touchpoints
- Allocate resources to channels with highest user interaction
- Optimize content or responses where engagement is low