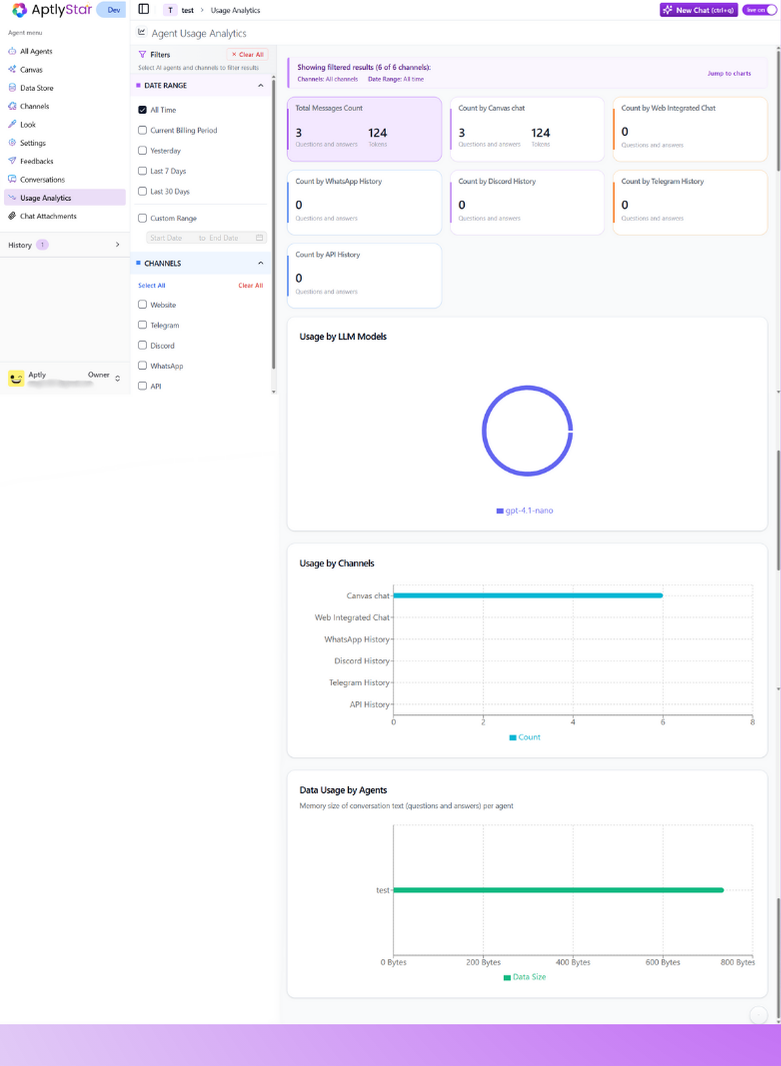
📊 Available Analytics Categories
Each card on this page tracks a specific usage type:- Playground Message: Interactions from the internal Aptly agent playground.
- Web History: Messages exchanged via the embedded widget on your website.
- WhatsApp History: Agent usage data from WhatsApp integration.
- Discord History: All queries received via your Discord channel.
- Telegram History: Logs of messages exchanged through the Telegram agent.
- API History: Tracks calls made to your agent via API.
🔍 Why Usage Analytics Matter
Here’s how this page helps you make smarter decisions:- Track performance: Know where your agent is most active.
- Identify adoption trends: Compare traction across platforms like Discord vs WhatsApp.
- Optimize support: Focus improvements on channels with the most traffic.
- Monitor effectiveness: Spot if answers match up to queries across sources.
Note: Data here reflects only successful message delivery — failed interactions aren’t counted.
🛠️ Enabling Accurate Analytics
To ensure this dashboard collects data:- Your agent must be Live (toggle must be switched on).
- Channels must be properly set up in the Channels tab.
- The agent should be actively engaged by users via any of the platforms above.