Telemetry Overview
The Telemetry dashboard gives you a clear picture of how your workspace is being used.It helps you understand user activity, feature interaction patterns, and overall system health.
Teams use this data to track adoption, identify friction points, investigate errors, and make informed product or workflow decisions.
Key Metrics Summary
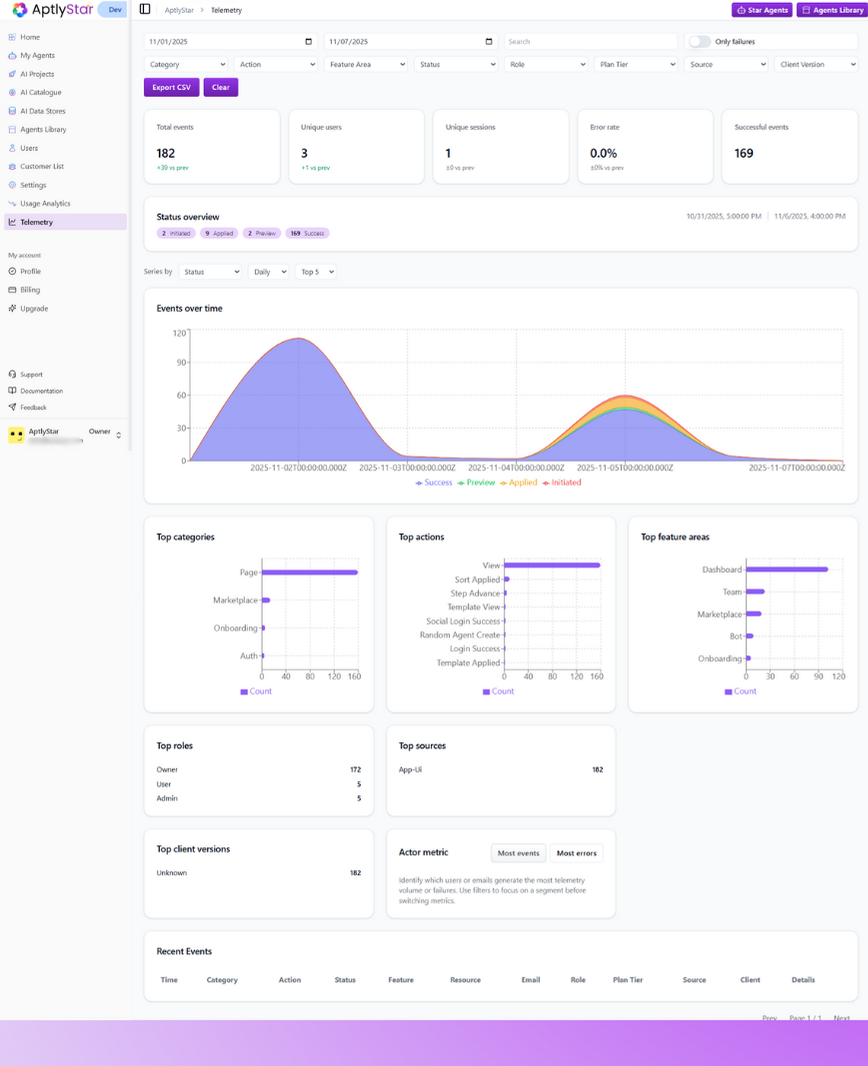
At the top of the telemetry page, you’ll find a quick snapshot of your system’s current activity.This includes how many users interacted with the platform, how many sessions took place, how many events succeeded or failed, and whether usage increased or decreased compared to previous periods.
This section provides an instant health check, helping you gauge engagement and stability at a glance.
Filters and Controls
Telemetry includes several filters that let you narrow down the data you’re viewing.Instead of scrolling through thousands of events, you can focus on specific time ranges, specific types of interactions, or even certain user groups.
These controls make it easy to answer questions like:
“Which features were used yesterday?”
“Who encountered an error?”
“What actions are happening most in a given project?” Each filter helps you isolate a slice of behavior so you can better understand how users are interacting with the system.
Status Overview and Event Trends
The status overview graph shows how activity changes over time.You can see whether interactions are increasing or decreasing, when peak usage occurs, and whether certain types of events (like applied actions or preview interactions) are happening more often.
This view is helpful for identifying patterns, planning rollouts, and understanding user rhythm — especially after a release or major update. The events over time chart makes it simple to spot spikes, dips, or unusual behavior that may require investigation.
Interaction Insights
Below the main chart, you’ll find several panels that break down activity by different perspectives.Categories
This section shows which parts of the platform users are interacting with most.It helps you understand which areas are drawing attention and which might require deeper engagement efforts.
Actions
This section highlights what users are doing — whether browsing, applying templates, navigating workflows, or performing setup actions.It gives you more context on how users move through the product.
Feature Areas
This view surfaces which product modules are used most often.It’s useful for understanding what features drive value and which ones may need redesign or discovery improvements.
Roles
Here you can see how different user roles engage with the system.This helps you confirm whether team members with different responsibilities are using features as expected.
Sources
This section shows where events originate — for example, from the main UI or other entry points.It helps you understand how people interact with the system across different access paths.
Client Versions
This view helps you track which client or widget versions are active.It’s valuable during phased rollouts or troubleshooting version-specific issues. Each of these panels gives you a different angle on the same activity, helping you build a complete picture of how people use your product.
Actor Metric
This section highlights the users or accounts contributing the most events or encountering the most issues.Instead of searching through logs manually, you immediately see which users generate the highest activity or where problems are concentrated.
It’s especially helpful for debugging — for example, noticing that a specific user or integration triggers unusual behavior.
Recent Event Logs
At the bottom of the page, telemetry displays a chronological list of individual events.Each event includes details like what action occurred, who performed it, what part of the system it came from, and whether it succeeded or failed.
This log is particularly helpful when investigating user reports, validating new features, or confirming that background actions executed correctly.
Telemetry provides complete visibility into user behavior and system activity, helping teams make confident product decisions, diagnose issues quickly, and understand how features are performing in real time.