> ## Documentation Index
> Fetch the complete documentation index at: https://docs.aptlystar.ai/llms.txt
> Use this file to discover all available pages before exploring further.
# Usage Analytics
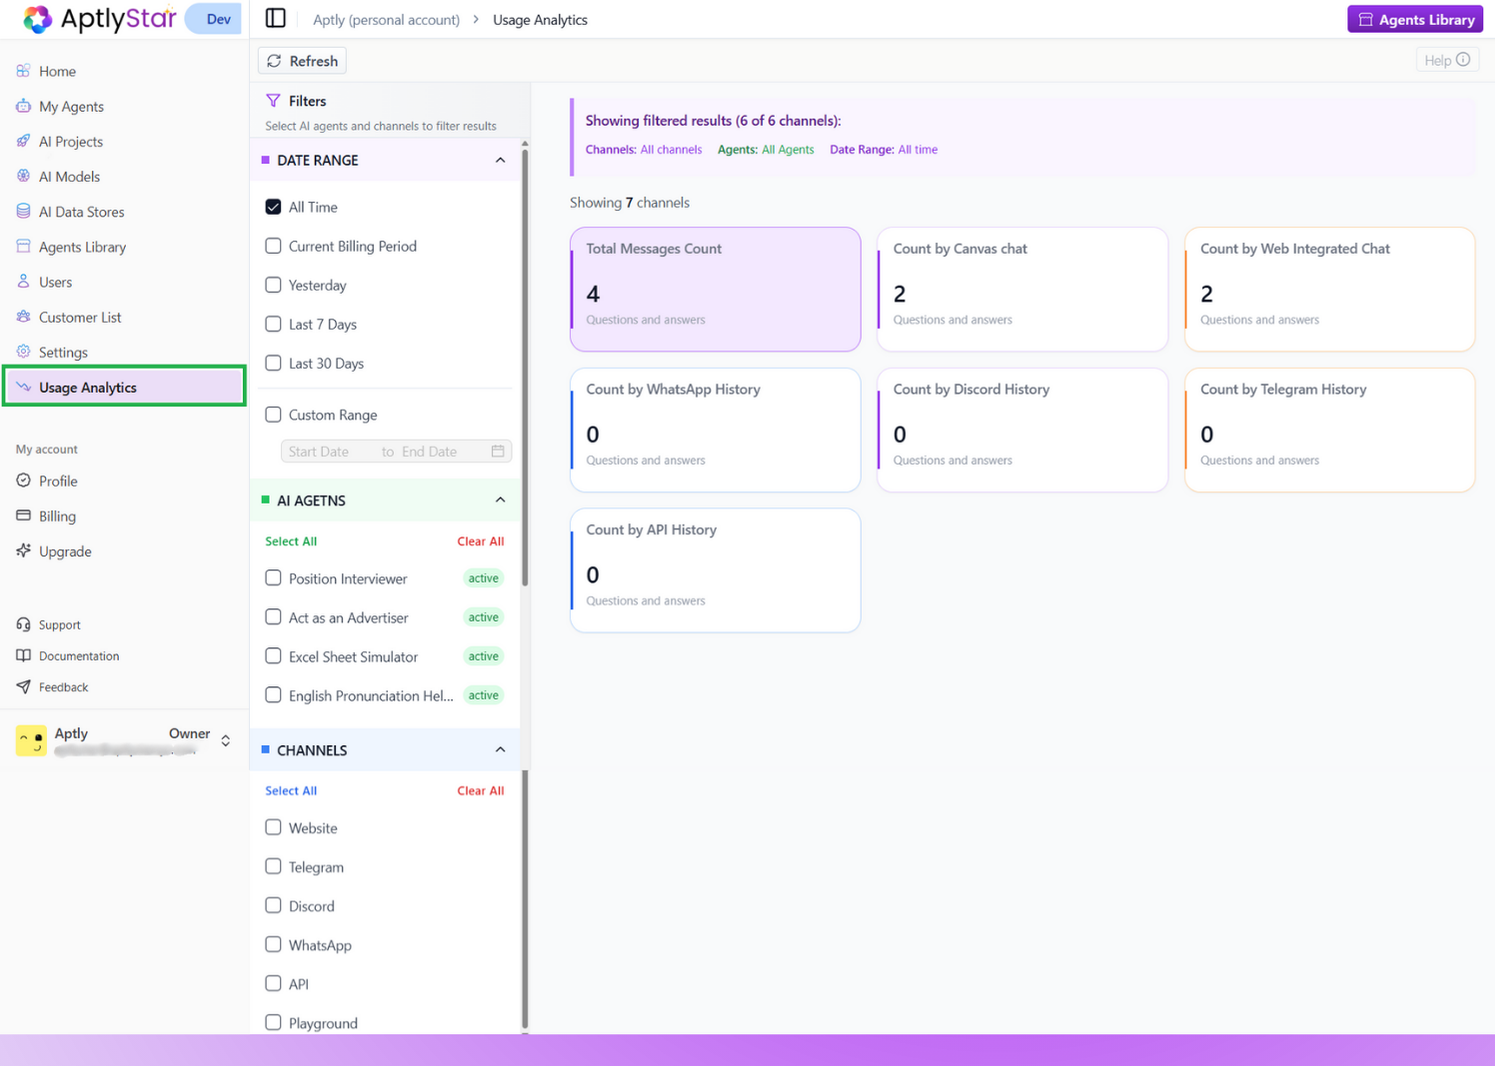
The **Usage Analytics** page offers a centralized dashboard to monitor how AI agents are being used across the organization. It provides granular visibility into conversations, agent activity, and channel distribution — all of which help drive smarter decisions and operational insights.
***
 ## What You Can Track
This view gives you channel-wise and agent-wise breakdowns of:
* Total number of questions and answers (Q\&A) exchanged
* Channel-specific traffic (e.g., Playground, Web, WhatsApp, Discord, API)
* Which agents were most active
* How usage has trended over time
> 📈 This data helps identify engagement hotspots, uncover underused channels, and optimize where your AI is delivering the most value.
***
## Filter Options
The left panel includes interactive filters to customize your analytics view.
### 🗓️ Date Range
Select the timeframe you want to analyze:
* All Time
* Yesterday
* Last 7 Days
* Last 30 Days
* Custom Range (using start and end dates)
> Useful for comparing usage trends across months or analyzing spikes post-feature launches.
***
### AI Agents
Toggle visibility for each AI agent in your org:
* Check or uncheck individual agents
* Filter for **active** or **offline** agents
* Use "Select All" or "Clear All" for convenience
> Great for seeing which agents are driving the most engagement or are currently inactive.
***
### Channels
Analyze performance across different communication channels:
* Website
* Telegram
* Discord
* WhatsApp
* API
* Playground
You can include or exclude channels depending on your use case — for example, isolating API usage or comparing live chat vs web widget behavior.
***
## Visual Insights
In addition to summary cards, the dashboard now includes **graphical breakdowns** to make insights more intuitive:
* **Bar graphs** to compare agent activity and channel performance
* **Pie charts** to visualize distribution of queries across LLM models
* **Trend visualizations** to quickly spot spikes or drops
## What You Can Track
This view gives you channel-wise and agent-wise breakdowns of:
* Total number of questions and answers (Q\&A) exchanged
* Channel-specific traffic (e.g., Playground, Web, WhatsApp, Discord, API)
* Which agents were most active
* How usage has trended over time
> 📈 This data helps identify engagement hotspots, uncover underused channels, and optimize where your AI is delivering the most value.
***
## Filter Options
The left panel includes interactive filters to customize your analytics view.
### 🗓️ Date Range
Select the timeframe you want to analyze:
* All Time
* Yesterday
* Last 7 Days
* Last 30 Days
* Custom Range (using start and end dates)
> Useful for comparing usage trends across months or analyzing spikes post-feature launches.
***
### AI Agents
Toggle visibility for each AI agent in your org:
* Check or uncheck individual agents
* Filter for **active** or **offline** agents
* Use "Select All" or "Clear All" for convenience
> Great for seeing which agents are driving the most engagement or are currently inactive.
***
### Channels
Analyze performance across different communication channels:
* Website
* Telegram
* Discord
* WhatsApp
* API
* Playground
You can include or exclude channels depending on your use case — for example, isolating API usage or comparing live chat vs web widget behavior.
***
## Visual Insights
In addition to summary cards, the dashboard now includes **graphical breakdowns** to make insights more intuitive:
* **Bar graphs** to compare agent activity and channel performance
* **Pie charts** to visualize distribution of queries across LLM models
* **Trend visualizations** to quickly spot spikes or drops
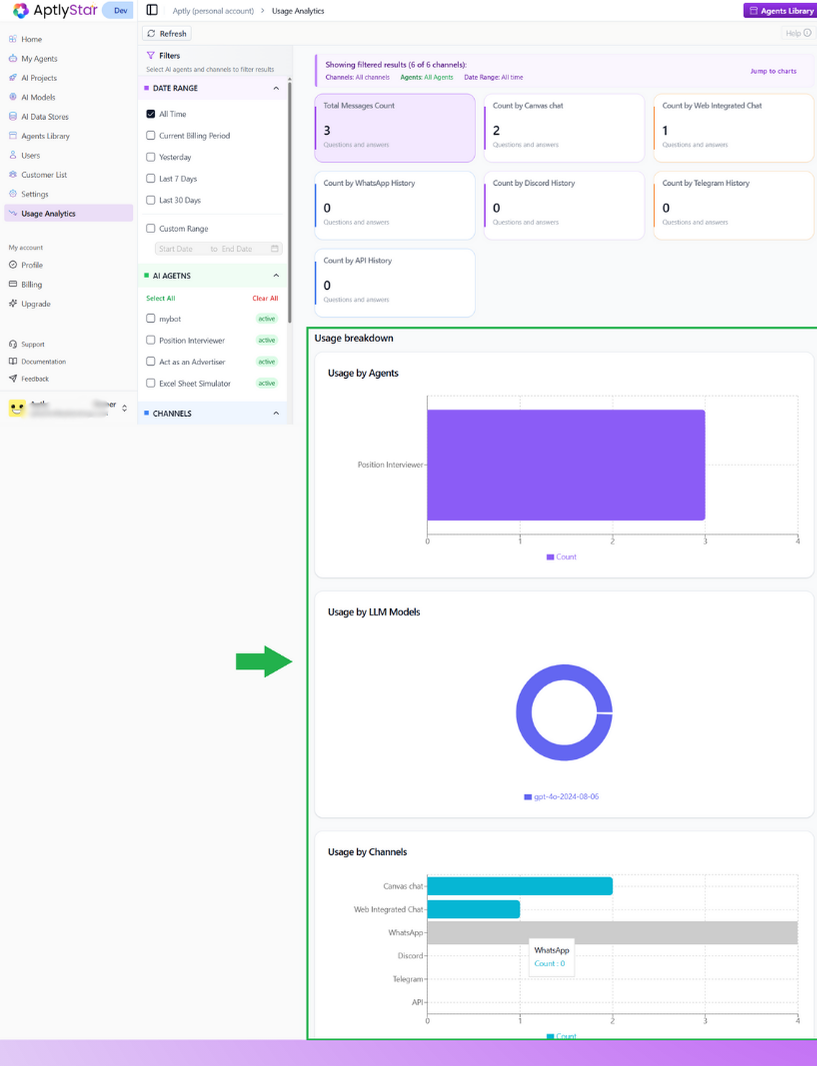 These charts make it easier to not only track numbers but also **see patterns at a glance** — helping teams interpret data faster and make informed decisions.
***
## Interpreting the Results
Once filters are applied, the right panel will display visual summary cards for each channel. Each card shows:
* **Total Q\&A count** for that channel
* A unified metric across all selected agents and date range
## Why It Matters
This page helps your organization:
* **Monitor real-time usage** across all AI integrations
* **Diagnose drops** or spikes in channel traffic
* **Audit agent activity** across internal and public touchpoints
* **Allocate resources** to channels with highest user interaction
* **Optimize content** or responses where engagement is low
Whether you're scaling support agents, tracking usage by department, or reporting engagement to stakeholders — this dashboard is essential for **AI ops**, **QA teams**, and **product managers** alike.
***
These charts make it easier to not only track numbers but also **see patterns at a glance** — helping teams interpret data faster and make informed decisions.
***
## Interpreting the Results
Once filters are applied, the right panel will display visual summary cards for each channel. Each card shows:
* **Total Q\&A count** for that channel
* A unified metric across all selected agents and date range
## Why It Matters
This page helps your organization:
* **Monitor real-time usage** across all AI integrations
* **Diagnose drops** or spikes in channel traffic
* **Audit agent activity** across internal and public touchpoints
* **Allocate resources** to channels with highest user interaction
* **Optimize content** or responses where engagement is low
Whether you're scaling support agents, tracking usage by department, or reporting engagement to stakeholders — this dashboard is essential for **AI ops**, **QA teams**, and **product managers** alike.
***